Radio Observatory
Designing a real-time observability system that turns raw radio signals into interpretable, decision-ready insights — used 24/7 and connected to an international scientific network.
Context
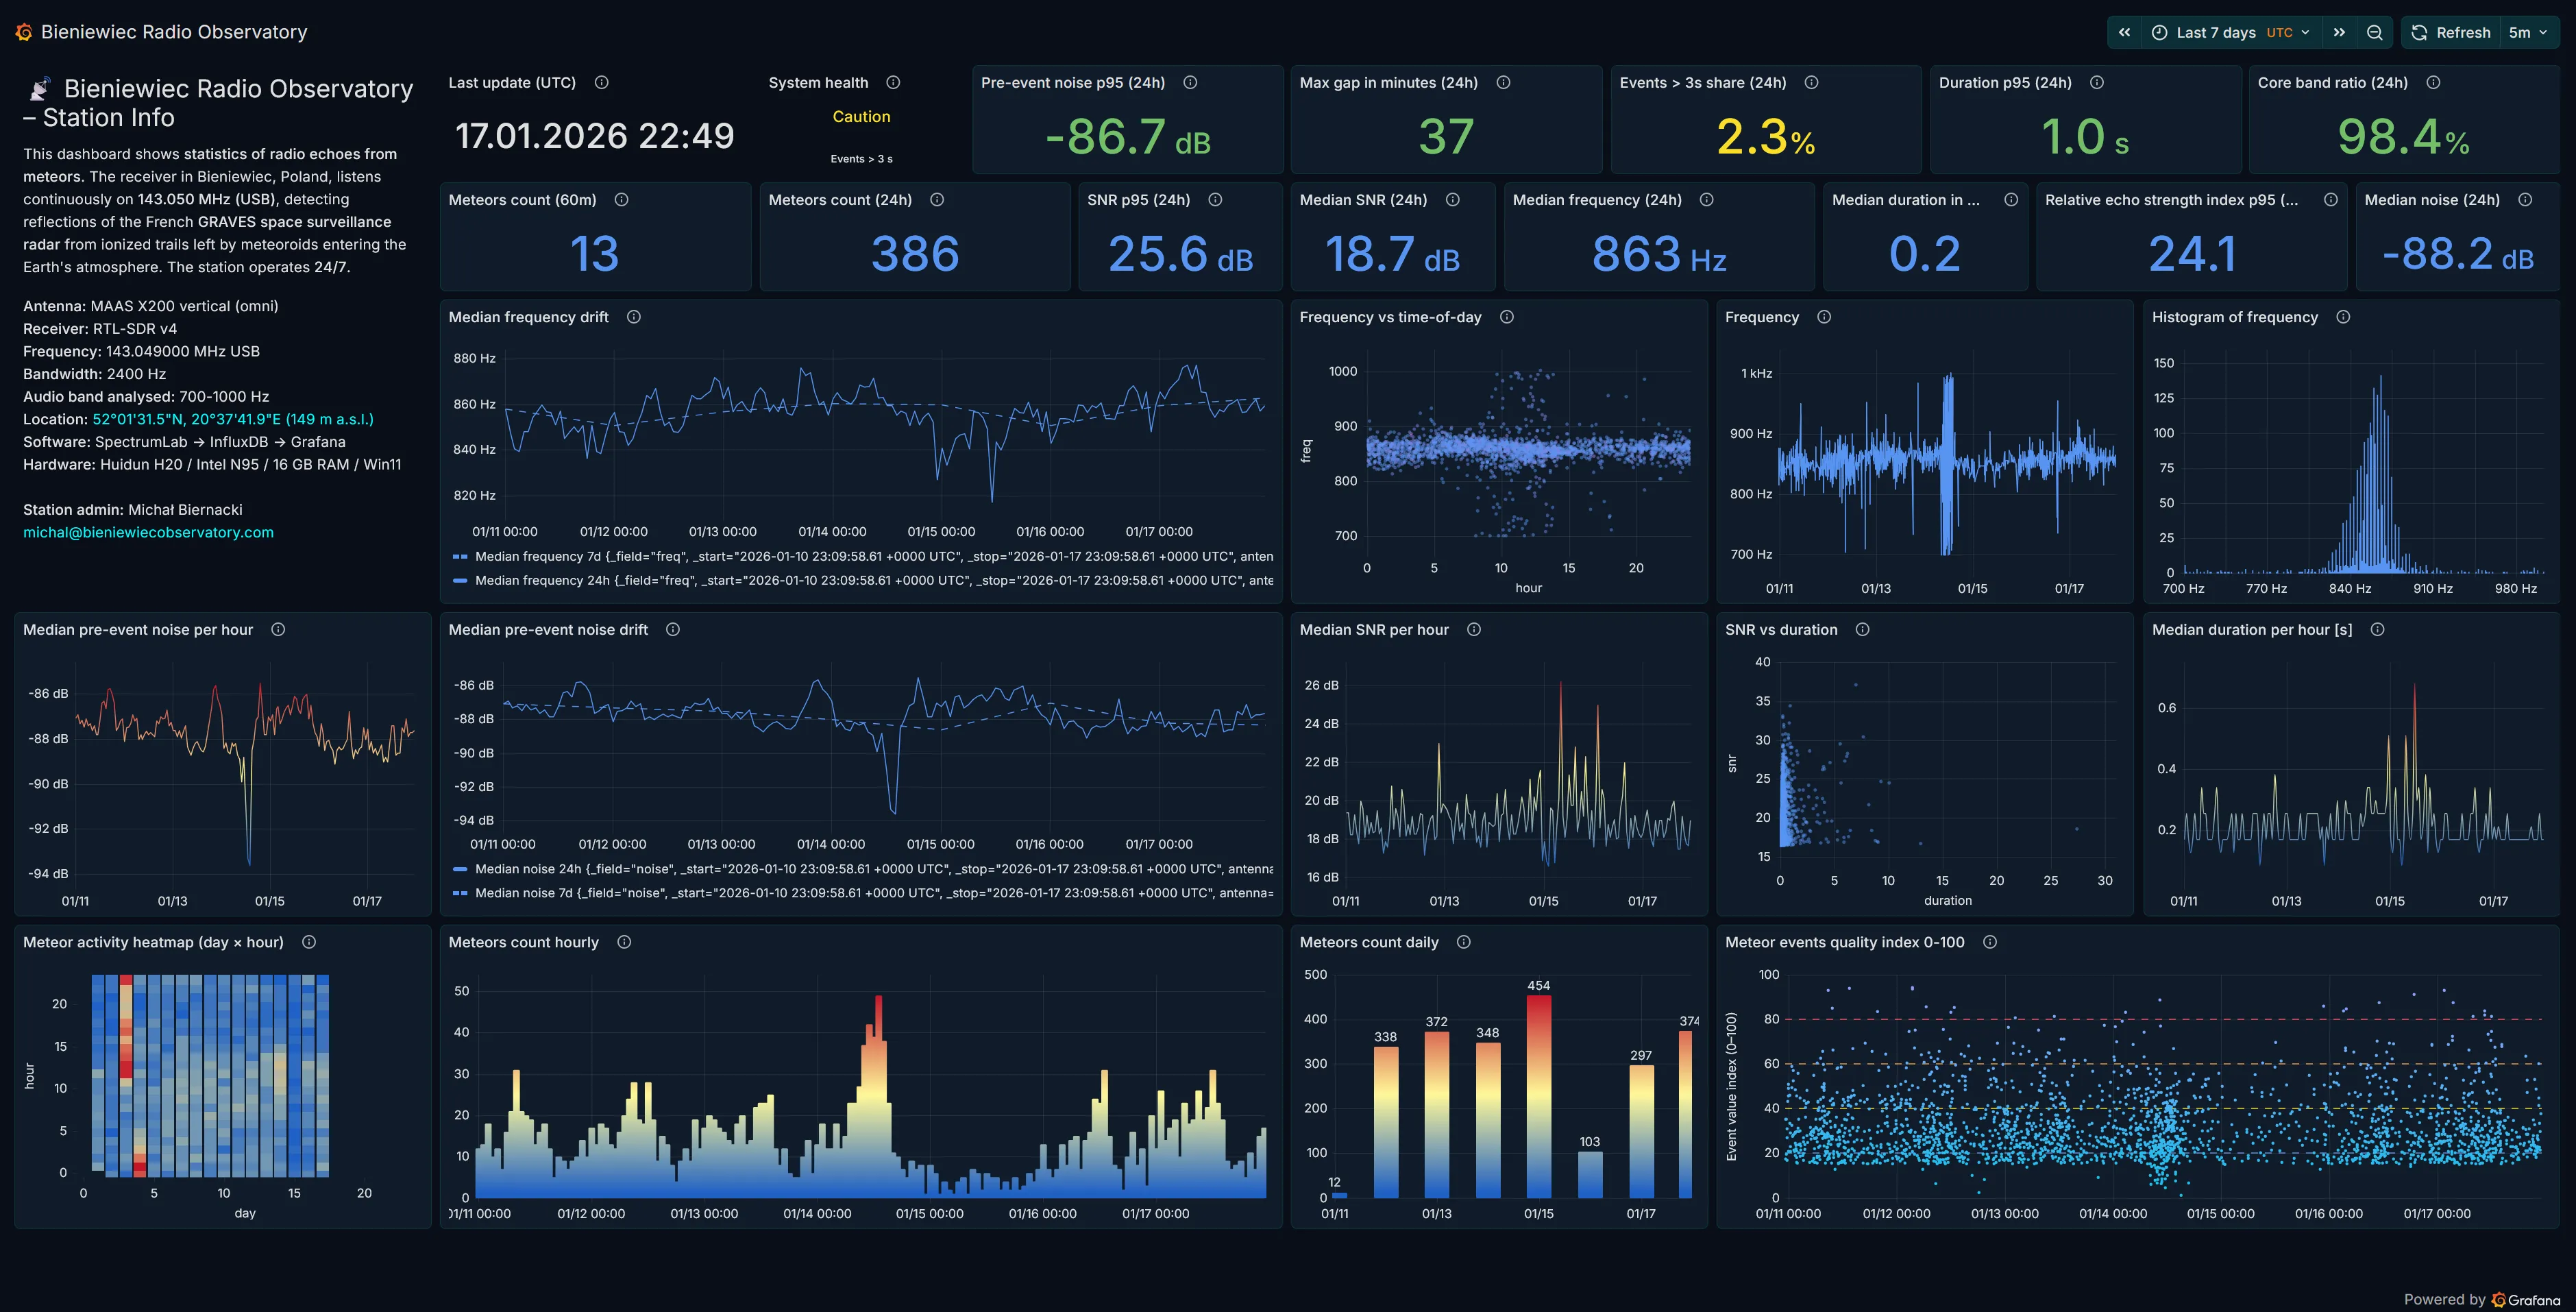
This project is an end-to-end, long-running system focused on detecting radio signal reflections caused by meteors entering Earth’s atmosphere. The station operates continuously and reports data both locally and to an international scientific network.
My goal was not only to make the system work, but to make its behavior understandable, trustworthy, and diagnosable over time.
The core problem
The central challenge was translating noisy, highly technical signal data into views that are meaningful for both domain experts and non-experts — without oversimplifying or hiding uncertainty.
This meant designing for interpretation, not just presentation.
Constraints & risks
- Highly noisy and unstable input data
- 24/7 operation with no predictable “happy path”
- Risk of false positives and misleading visual patterns
- Need for long-term consistency and comparability of metrics
My role
I owned the system end to end: signal analysis logic, data modeling, metric definitions, dashboard structure, and UX decisions.
The work combined systems thinking, data modeling, UX design, and continuous iteration based on observed system behavior over time.

Key UX decisions
- Designing explicit system health indicators instead of hiding anomalies
- Separating raw measurements from derived, interpretive metrics
- Making uncertainty visible rather than smoothing it away
- Supporting both quick status checks and deep analytical exploration
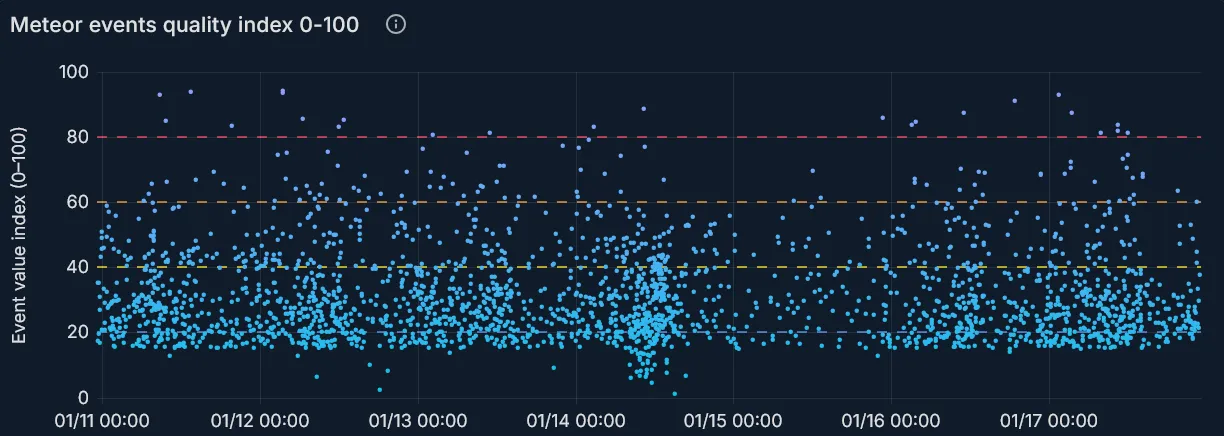
Custom signal quality model
One of the key elements is an original signal quality model that combines signal-to-noise ratio, frequency drift, and event duration into a single interpretable visualization.
The goal was to distinguish meaningful meteor events from background noise without relying on rigid binary thresholds.
Outcomes
- Stable 24/7 operation with transparent system health monitoring
- Hourly data reporting to an international scientific network
- A system usable both for expert analysis and exploratory learning
Live system
The system is publicly available and continuously updated.
What I learned
Designing data-heavy systems is less about visual polish and more about responsibility: making trade-offs explicit, respecting uncertainty, and supporting informed decisions over time.